
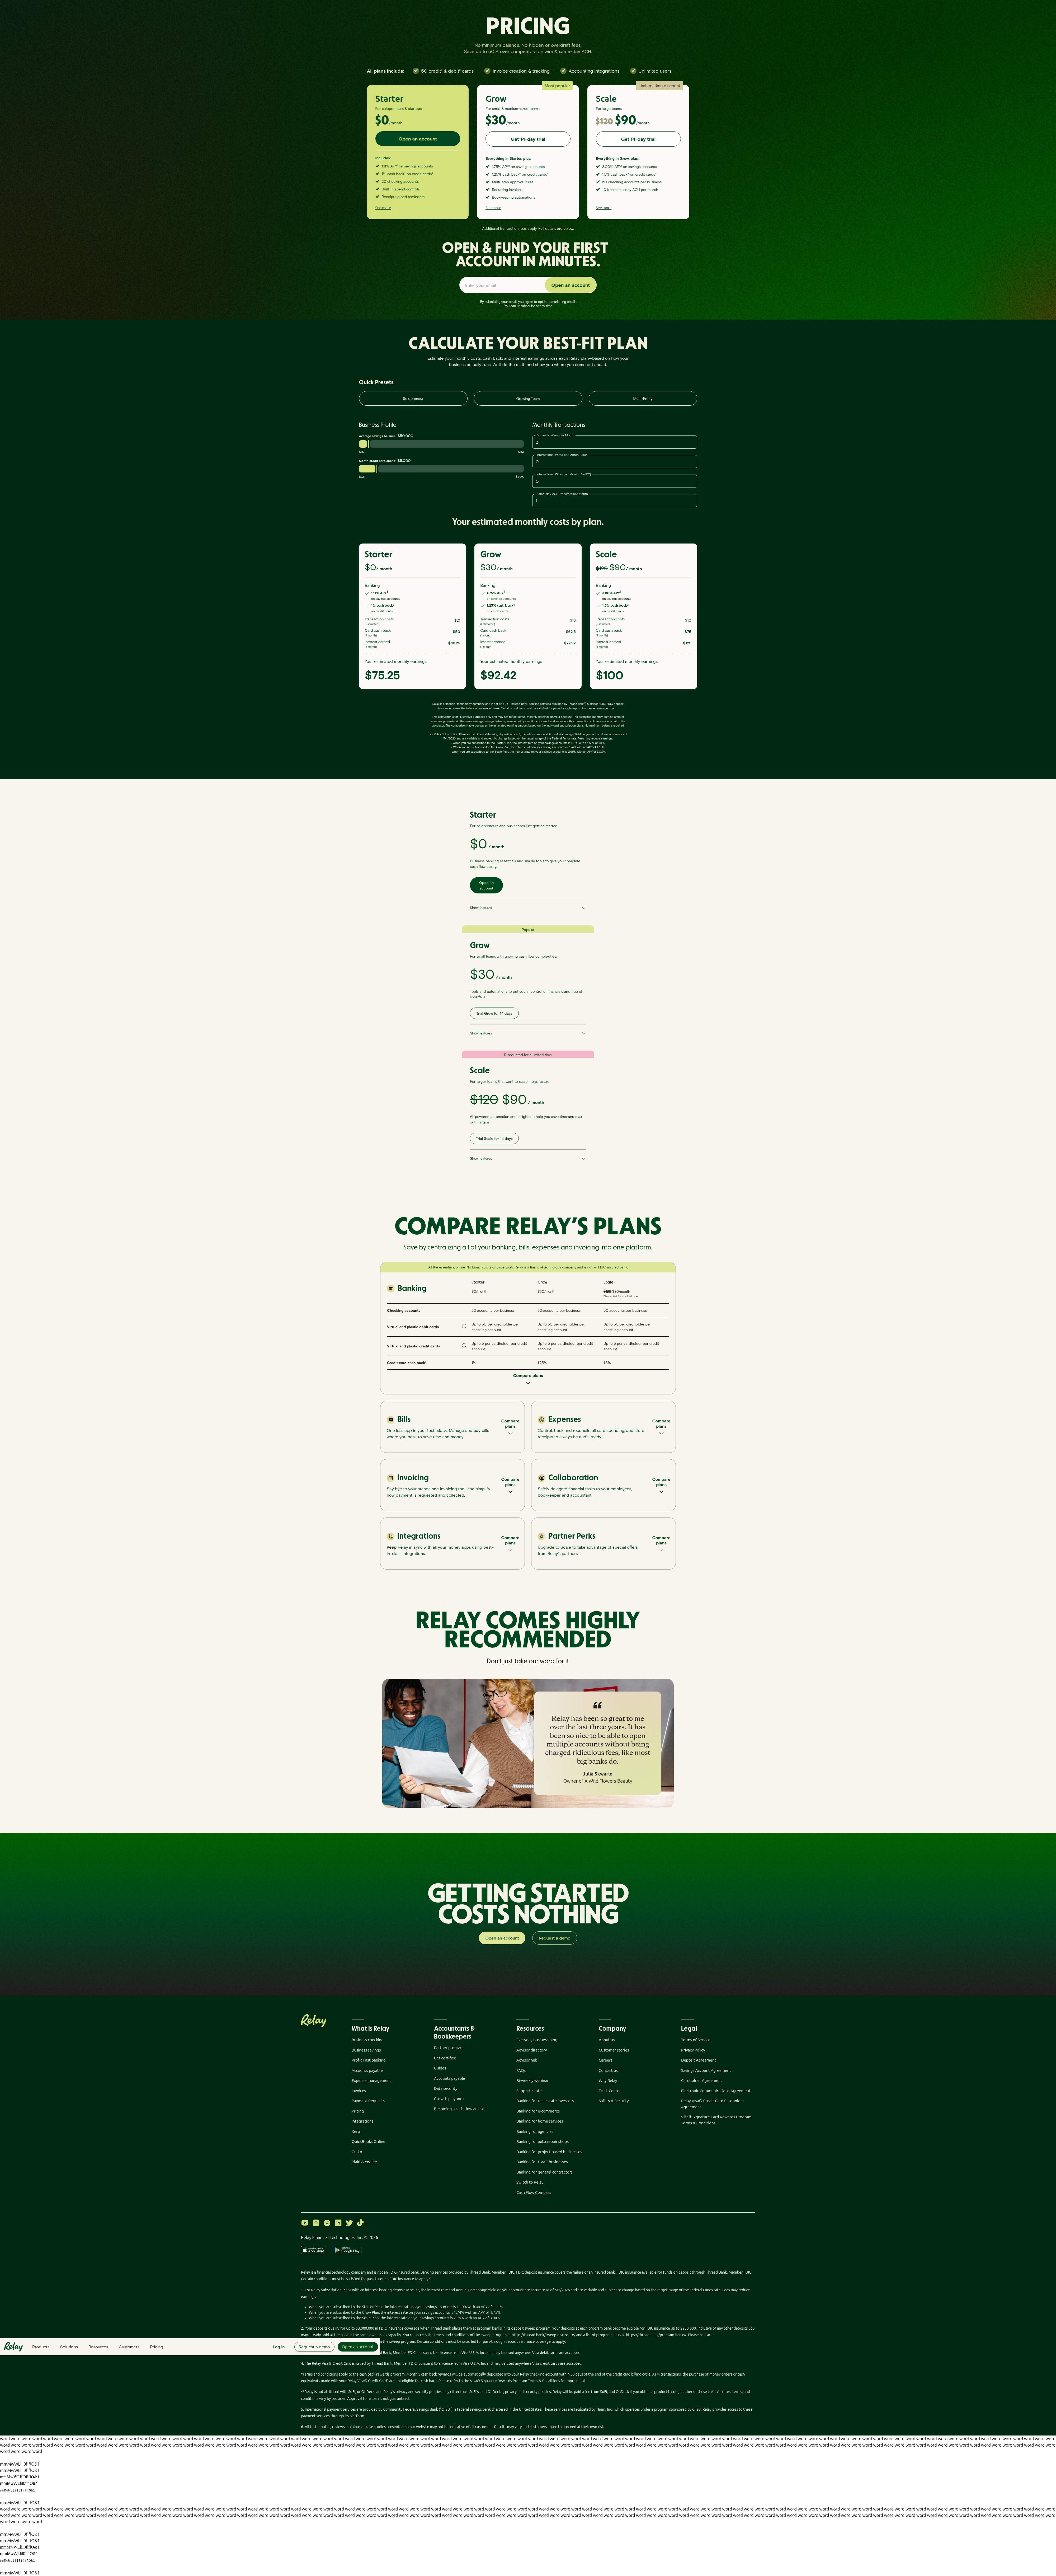
Relay's Pricing Calculator: Personalization Beats the Static Table
Relay replaced a generic pricing table with a calculator that estimates costs and earnings per plan. Here's why this pattern is rare, and what it signals for 2026 roadmaps.
Maya Patel
Senior CRO Strategist · · Updated
Relay (relayfi.com) has quietly rebuilt its pricing page around a single interactive module. Instead of three static columns and a feature checklist, visitors get a calculator that asks for savings balance, credit card spend, and monthly transaction volume — then returns a personalized estimate of monthly cost and earnings for every plan tier. We flagged this on 14 March 2026 as an 85% rarity detection, and it's worth breaking down why.
TL;DR
- Detected 14 March 2026 on Relay's pricing page (relayfi.com/pricing)
- Rarity score: 85% — one of the least common pricing-page patterns in our tracked set
- Importance score: 80%, reflecting high potential impact on qualified sign-up rate
- Calculator inputs: savings balance, credit card spend, monthly transactions
- Outputs: estimated monthly cost AND estimated earnings (cash back + interest) per plan
- Category: interactive calculator, a subset of pricing-page personalization we rarely see live
What exactly did Relay change on its pricing page?
Relay swapped a standard three-tier comparison table for an inline calculator that computes a personalized cost-versus-earnings estimate before the visitor signs up. The on-page copy frames it plainly: "CALCULATE YOUR BEST-FIT PLAN — Estimate your monthly costs, cash back, and interest earnings across each Relay plan—based on how your business actually runs." That's a materially different job for the page. A conventional pricing table answers "what do I get at each tier?" This module answers "what does this actually cost me, and what do I get back?" — collapsing two separate mental calculations (cost justification and ROI) into one interaction.
Why is this rare in pricing-page tests?
Most pricing-page experiments we log are shallow — copy swaps, badge placement, toggle defaults — because building a real-time cost/earnings model is expensive to engineer and risky to get wrong. Static comparison tables are the default because they're cheap, safe, and easy to localize. A calculator requires accurate backend logic tied to actual fee schedules, cash-back tiers, and interest rates, and it has to stay synchronized every time pricing changes. That maintenance burden is almost certainly why we see this pattern in only a small fraction of the pricing pages we monitor — most teams settle for a comparison grid and call it done.
The bigger reason it's rare, though, is confidence. A generic table lets you hide ambiguity behind "starting at $X/mo." A calculator forces you to commit to a specific number for a specific visitor, in public, before they've given you an email address. That's a real business risk if the number comes out unflattering for a segment you want to convert. Relay's willingness to show that number anyway is the more interesting signal than the UI itself.
How does this compare to standard pricing-page CRO practice?
Standard practice treats personalization as a nice-to-have; this treats it as the core value proof. Most CRO guidance for 2026 pushes toward tailoring the page to the visitor rather than showing everyone the same static content — Aimers' best-practices roundup calls one-size-fits-all messaging one of the most underappreciated failure points on landing pages, noting that personalization "closes the gap" between generic claims and visitor relevance. Relay's calculator is that principle taken to its logical endpoint on a page type — pricing — that is usually the least personalized surface on a site.
It also matches a pattern in the broader CRO literature around reducing cognitive load by doing the visitor's math for them rather than asking them to do it. Unbounce's CRO best-practices guide frames this as removing friction between interest and decision — the fewer manual steps a visitor has to take to understand value, the less drop-off you get at that step. A three-input calculator that outputs both a cost and an earnings figure is a compact way to do exactly that, provided the inputs are genuinely low-effort (savings balance, card spend, transaction count are all numbers a business owner already knows off the top of their head).
What's the tradeoff profile here?
| Factor | Static pricing table | Relay-style calculator |
|---|---|---|
| Build/maintenance cost | Low | High — needs live rate logic |
| Perceived relevance | Generic | High, per-visitor |
| Risk of unflattering output | None (ambiguous) | Real, for edge-case inputs |
| Time-on-page / engagement | Low | Likely higher (interaction required) |
| Sales-qualification signal | None | Strong — inputs double as firmographic data |
The last row matters more than it looks. Every calculator submission is effectively a mini-qualification form disguised as a value tool. Relay gets savings balance, spend, and transaction volume — three of the exact variables a fintech sales or lifecycle team would want to segment on — without ever calling it a form.
Applying an ICE lens: is this worth copying?
Impact is high if your product has genuinely tiered economics (subscription-plus-usage, cash back, interest, or fee-offset models) where the "right" plan differs meaningfully by user profile. Confidence is moderate — we don't have Relay's before/after conversion data, only the rarity and importance of the pattern itself. Cost is the real gate: this isn't a copy test you ship in an afternoon, it's a small feature with real engineering and legal/compliance review (estimated earnings claims need to be defensible). Teams with simple, flat pricing should skip this pattern entirely — a calculator with no meaningful cost variance across tiers just adds friction for no payoff, which is the opposite of what Heyflow's step-by-step guide recommends when it stresses matching page complexity to actual decision complexity.
Common questions
What did Relay change on its pricing page?
Relay added an interactive calculator that takes savings balance, credit card spend, and monthly transaction count as inputs, then outputs a personalized estimated monthly cost and estimated earnings (cash back plus interest) for each of its plan tiers, replacing a purely static comparison table.
When was this detected?
ABWatcher logged this pattern on Relay's pricing page on 14 March 2026, scoring it 85% on rarity and 80% on importance relative to other pricing-page changes tracked across our monitored set of 1,000+ sites.
Why don't more companies build pricing calculators?
The main blockers are engineering cost (keeping calculator logic synced with live rate/fee schedules) and business risk (showing a specific, potentially unflattering number to a specific visitor before they convert), which is why most teams default to a safer static comparison table instead.
Is this pattern only relevant to fintech?
No — the underlying principle, doing the visitor's ROI math for them instead of asking them to estimate it, applies anywhere pricing varies meaningfully by usage pattern, including usage-based SaaS, marketplaces with tiered take rates, and any subscription-plus-rewards model.
What's the fastest way to test a lighter version of this?
Start with a two-input estimator (one usage variable, one output metric) on a single high-traffic plan tier rather than building full multi-tier logic — this keeps engineering scope small while still testing whether personalized output outperforms your static table on click-through to sign-up.
The takeaway for your sprint
Before you greenlight a full calculator build, run the cheaper test first: add one dynamic, input-driven number to your existing pricing table — even something as simple as "estimated monthly savings based on your team size" — and measure click-through to sign-up against your current static version. If that lift is real, you've validated the underlying hypothesis (personalized ROI beats generic tiers) before committing engineering time to Relay's full three-input model.
Read next
More from the ABWatcher blog
Nov 22, 2026
Snake River Farms Tests a $25-Off Popup on Its Ad Landing Page
We caught Snake River Farms split-testing an email-capture form and $25-off modal on its landing page. Here's the math on what it would take to call a winner.
Nov 21, 2026
Snake River Farms Tests Mid-Page Email Capture on Its Ad Landing Page
SRF is A/B testing a mid-page lead-capture block and a $25-off popup against a simpler hero-only promo banner on its paid landing page, detected 2024 week-over-week.
Nov 20, 2026
Attio Is Testing a New Tier, Higher Prices, and a New Pitch
Attio is running a live pricing page test with a new $1,000 "Ultra" tier, higher Plus/Pro prices, and a new headline — here's what we caught and what it means.
Nov 19, 2026
Found Quietly Tested a 25% Price Cut on Its Pricing Page
We caught Found running a live pricing A/B test with an annual billing toggle that drops Found Plus from $35 to $26.25/mo. Here's what changed and why it matters.
Nov 8, 2026
Astro Proves "Zero Lock-In" With a Live Code Demo, Not a Claim
Astro's homepage replaces a trust badge row with a working, clickable framework demo — here's the hierarchy and interaction design behind it, detected 60% rare on astro.build.
Nov 7, 2026
Basecamp's Big Numbers: Why Hyper-Precise Stats Beat Vague Social Proof
Basecamp's homepage swaps "trusted by thousands" for 1.7 billion to-dos and 5 petabytes of data. We break down why precision beats vagueness as social proof — and how to test it.
From the glossary
Vocabulary the article uses. See all terms →
- Shrinkage Estimator— A statistical adjustment that pulls noisy per-variant or per-segment estimates toward an overall average to reduce overfitting to randomness.
- Flicker Test— A diagnostic check to confirm whether users briefly see the original page before a variant renders in client-side experiments.
- Pre-Experiment Bucketing Audit— A review process confirming users are being randomly and evenly assigned to experiment variants before launch.
- Above-Fold Exclusion Rule— A test-design rule that deliberately prevents changes to above-the-fold elements so an experiment isolates below-the-fold effects.
- Flicker-Free Testing— A technical setup that prevents users from briefly seeing the original page before a test variant loads.
- Orthogonal Test Design— A test structure where multiple variables are changed independently so their individual effects can be measured without interference.
See more like this
ABWatcher catches A/B tests like this across 1,000+ brands.
Watch live experiments at 1,000+ high-converting brands, complete with hypothesis and takeaway. 7 days of Pro, free, no card, then Free forever for ten watched companies.