
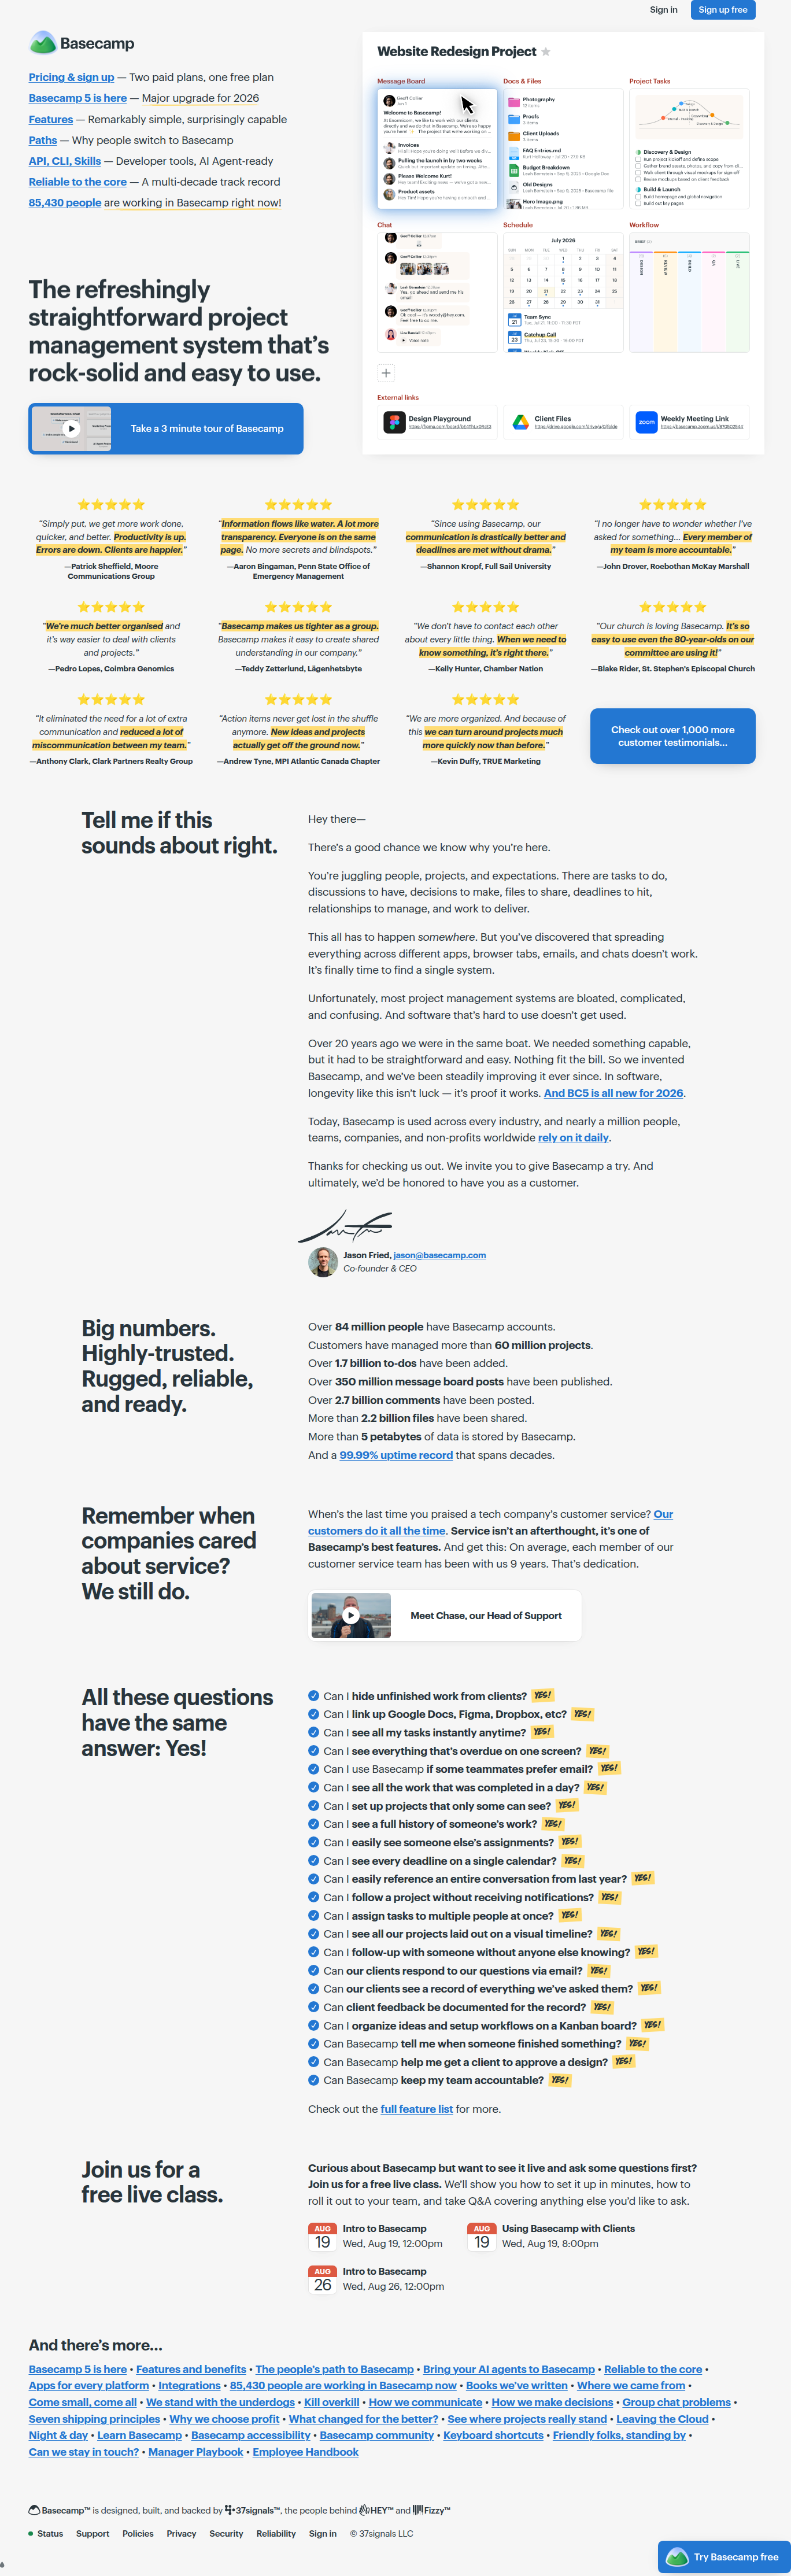
Basecamp's Big Numbers: Why Hyper-Precise Stats Beat Vague Social Proof
Basecamp's homepage swaps "trusted by thousands" for 1.7 billion to-dos and 5 petabytes of data. We break down why precision beats vagueness as social proof — and how to test it.
Sam Lee
Data Analyst · · Updated
TL;DR
- Detected 60% rarity pattern on basecamp.com homepage, social_proof surface, logged as "Absurdly specific 'Big numbers' stat block."
- Evidence quote: "Over 1.7 billion to-dos have been added... More than 5 petabytes of data is stored by Basecamp."
- Stack includes 2.7 billion comments and 99.99% uptime — four metrics, each oddly precise rather than rounded.
- Importance scored 45% — a notable pattern, not a guaranteed high-leverage test for every site.
- Unbounce's own LPO research found only a ~1% conversion delta between pages with and without social proof blocks (source).
- No variant/control split was observable — this is a single-arm detection, not a confirmed A/B win.
What did Basecamp actually change on its homepage?
Basecamp replaced generic trust copy with four absurdly specific scale metrics: 1.7 billion to-dos, 2.7 billion comments, 5 petabytes of data stored, and 99.99% uptime. Most SaaS homepages default to rounded, forgettable claims — "trusted by thousands of teams," "millions of tasks completed." Basecamp's block does the opposite. The numbers aren't rounded to the nearest convenient unit; they read like they were pulled straight from a production database query, which is precisely the point. Precision itself becomes the credibility signal: a vague number is easy to invent, a weirdly specific one implies someone actually ran SELECT COUNT(*).
This is a single-page detection with a rarity score of 60% — meaning we see this pattern on roughly 4 in 10 comparable homepage audits, making it uncommon but not unheard of. Importance sits at 45%, a moderate-not-urgent signal in our scoring, which matters for how you should read this: it's worth studying, not blindly copying.
Why does precision outperform vague social proof claims?
Specific numbers function as a "hard to fake" heuristic — vague claims require trust, precise ones imply verifiability, even when nobody actually checks. The psychological mechanism is adjacent to what's sometimes called the "precision effect" in judgment-and-decision-making research: a price or quantity stated with unusual granularity (e.g., "$19,997" vs "$20,000") is processed as more credibly sourced, because round numbers pattern-match to estimates while precise ones pattern-match to measurements. Basecamp's "1.7 billion" does the same cognitive work "4.97 stars from 1,842 reviews" does on an ecommerce PDP — it signals this came from a system, not a copywriter.
It also sidesteps a well-documented ceiling on social proof's actual lift. Optimizely's own LPO glossary cites Unbounce data showing only about a 1% conversion difference between pages that include social proof and those that don't — "still something, and you'd rather have it than not," but not the double-digit lift growth decks like to imply. If you're modeling impact, a 1% relative lift on a $50M ARR signup funnel is roughly $500K annualized, not nothing, but not a headline either. The absurdly-specific framing may be an attempt to extract more than the typical 1% out of a social proof slot that usually underperforms expectations.
How does this compare to typical social proof patterns?
| Pattern | Example copy | Verifiability signal | Typical observed lift |
|---|---|---|---|
| Vague aggregate | "Trusted by thousands of teams" | Low — unfalsifiable | ~0-1% (per Unbounce/Optimizely) |
| Rounded big number | "Over 1 million users" | Low-medium | ~1% |
| Hyper-precise stat | "1.7 billion to-dos added" | High — implies telemetry | Untested publicly; plausible premium over rounded |
| Named logos/testimonials | Customer logos, quotes | Medium — identity-verifiable | Varies widely by segment |
The absurdly-specific stat block sits in a gap current public research hasn't filled: nobody's published a clean, powered A/B test isolating "round number" vs. "precise number" copy on a live SaaS homepage. That's exactly why we flagged it as rare rather than best-practice-confirmed.
Is this actually an A/B test, or just good copywriting?
This detection is a static pattern on a live page, not a confirmed split test, so treat it as a hypothesis worth stealing rather than a proven win. We didn't observe a control arm serving vague copy to a holdout segment, which means we can't report a confidence interval, a lift percentage, or a sample size — the three things I'd want before calling anything a win. Basecamp also has unusual brand equity (18+ years, Jason Fried's writing reputation, a founder-led content engine) that may itself inflate trust independent of the stat block's wording. That's a classic confound: you can't separate "precise numbers work" from "Basecamp's blog readership already trusts them" without running this on a brand without that halo.
Separately, Tenet's landing page research notes Basecamp's broader pattern of narrative-driven, frustration-first copywriting aimed at users who've already churned off competitor tools — the big-numbers block likely reinforces that same "we've been doing this longer and at more scale than anyone" narrative rather than acting as an isolated social proof widget.
What should growth teams test this sprint?
If your homepage currently runs rounded, vague trust copy ("trusted by thousands"), there's a cheap, low-risk test here: swap in your most precise, least-rounded real metric and measure signup or trial-start conversion over at least 2-4 weeks to average out day-of-week and novelty effects. Minimum sample size matters — if your homepage gets under ~10K weekly visitors, you likely don't have the power to detect anything smaller than a 3-5% relative lift at 95% confidence within a reasonable test window, so don't kill a promising variant after three days of noisy data. Segment the readout too: precision-as-credibility probably lands harder with technical/dev-adjacent audiences (who intuitively trust "queried from prod") than with less technical buyers who may not parse "5 petabytes" as meaningful at all. Run it, segment it, and don't call it a win without the interval.
Common questions
Is Basecamp's big-numbers block confirmed to lift conversion?
No. This is a static detection of live copy, not a published A/B result. We have no control arm, no sample size, and no confidence interval — only Basecamp's choice to run hyper-precise numbers instead of vague aggregate claims as of this detection.
Why would specific numbers be more persuasive than round ones?
Precise numbers imply the figure came from measurement rather than estimation, which reads as more credible even without verification. This mirrors pricing research on non-round numbers (e.g., "$19,997") being perceived as more carefully sourced than rounded equivalents.
How much does social proof typically lift conversion rate?
Public benchmark data from Unbounce, cited via Optimizely's glossary, puts the typical conversion delta around 1% between pages with and without social proof blocks. That's a real but modest effect — useful context before over-indexing on any single social proof tactic.
What sample size do I need to test this on my own homepage?
It depends on your baseline conversion rate and desired minimum detectable effect, but as a rule of thumb, sites under 10,000 weekly visitors struggle to reliably detect lifts smaller than 3-5% relative at 95% confidence within a few weeks. Run a power calculation before committing to a test window.
Could this be a novelty effect rather than a durable pattern?
Possibly. Because this is a single-brand, single-arm detection rather than a repeated-measures test, we can't rule out that any lift (if present) is driven by novelty or by Basecamp's existing brand trust rather than the copy pattern itself.
Read next
More from the ABWatcher blog
Nov 22, 2026
Snake River Farms Tests a $25-Off Popup on Its Ad Landing Page
We caught Snake River Farms split-testing an email-capture form and $25-off modal on its landing page. Here's the math on what it would take to call a winner.
Nov 21, 2026
Snake River Farms Tests Mid-Page Email Capture on Its Ad Landing Page
SRF is A/B testing a mid-page lead-capture block and a $25-off popup against a simpler hero-only promo banner on its paid landing page, detected 2024 week-over-week.
Nov 20, 2026
Attio Is Testing a New Tier, Higher Prices, and a New Pitch
Attio is running a live pricing page test with a new $1,000 "Ultra" tier, higher Plus/Pro prices, and a new headline — here's what we caught and what it means.
Nov 19, 2026
Found Quietly Tested a 25% Price Cut on Its Pricing Page
We caught Found running a live pricing A/B test with an annual billing toggle that drops Found Plus from $35 to $26.25/mo. Here's what changed and why it matters.
Nov 8, 2026
Astro Proves "Zero Lock-In" With a Live Code Demo, Not a Claim
Astro's homepage replaces a trust badge row with a working, clickable framework demo — here's the hierarchy and interaction design behind it, detected 60% rare on astro.build.
Nov 6, 2026
Windsurf's Contrarian Bet: Selling "No Lock-In" as the Hero Message
Codeium Windsurf's homepage leads with model-agnostic positioning instead of its own model — a contrarian CRO play worth studying before you copy it.
From the glossary
Vocabulary the article uses. See all terms →
- Shrinkage Estimator— A statistical adjustment that pulls noisy per-variant or per-segment estimates toward an overall average to reduce overfitting to randomness.
- Flicker Test— A diagnostic check to confirm whether users briefly see the original page before a variant renders in client-side experiments.
- Pre-Experiment Bucketing Audit— A review process confirming users are being randomly and evenly assigned to experiment variants before launch.
- Above-Fold Exclusion Rule— A test-design rule that deliberately prevents changes to above-the-fold elements so an experiment isolates below-the-fold effects.
- Flicker-Free Testing— A technical setup that prevents users from briefly seeing the original page before a test variant loads.
- Orthogonal Test Design— A test structure where multiple variables are changed independently so their individual effects can be measured without interference.
See more like this
ABWatcher catches A/B tests like this across 1,000+ brands.
Watch live experiments at 1,000+ high-converting brands, complete with hypothesis and takeaway. 7 days of Pro, free, no card, then Free forever for ten watched companies.