
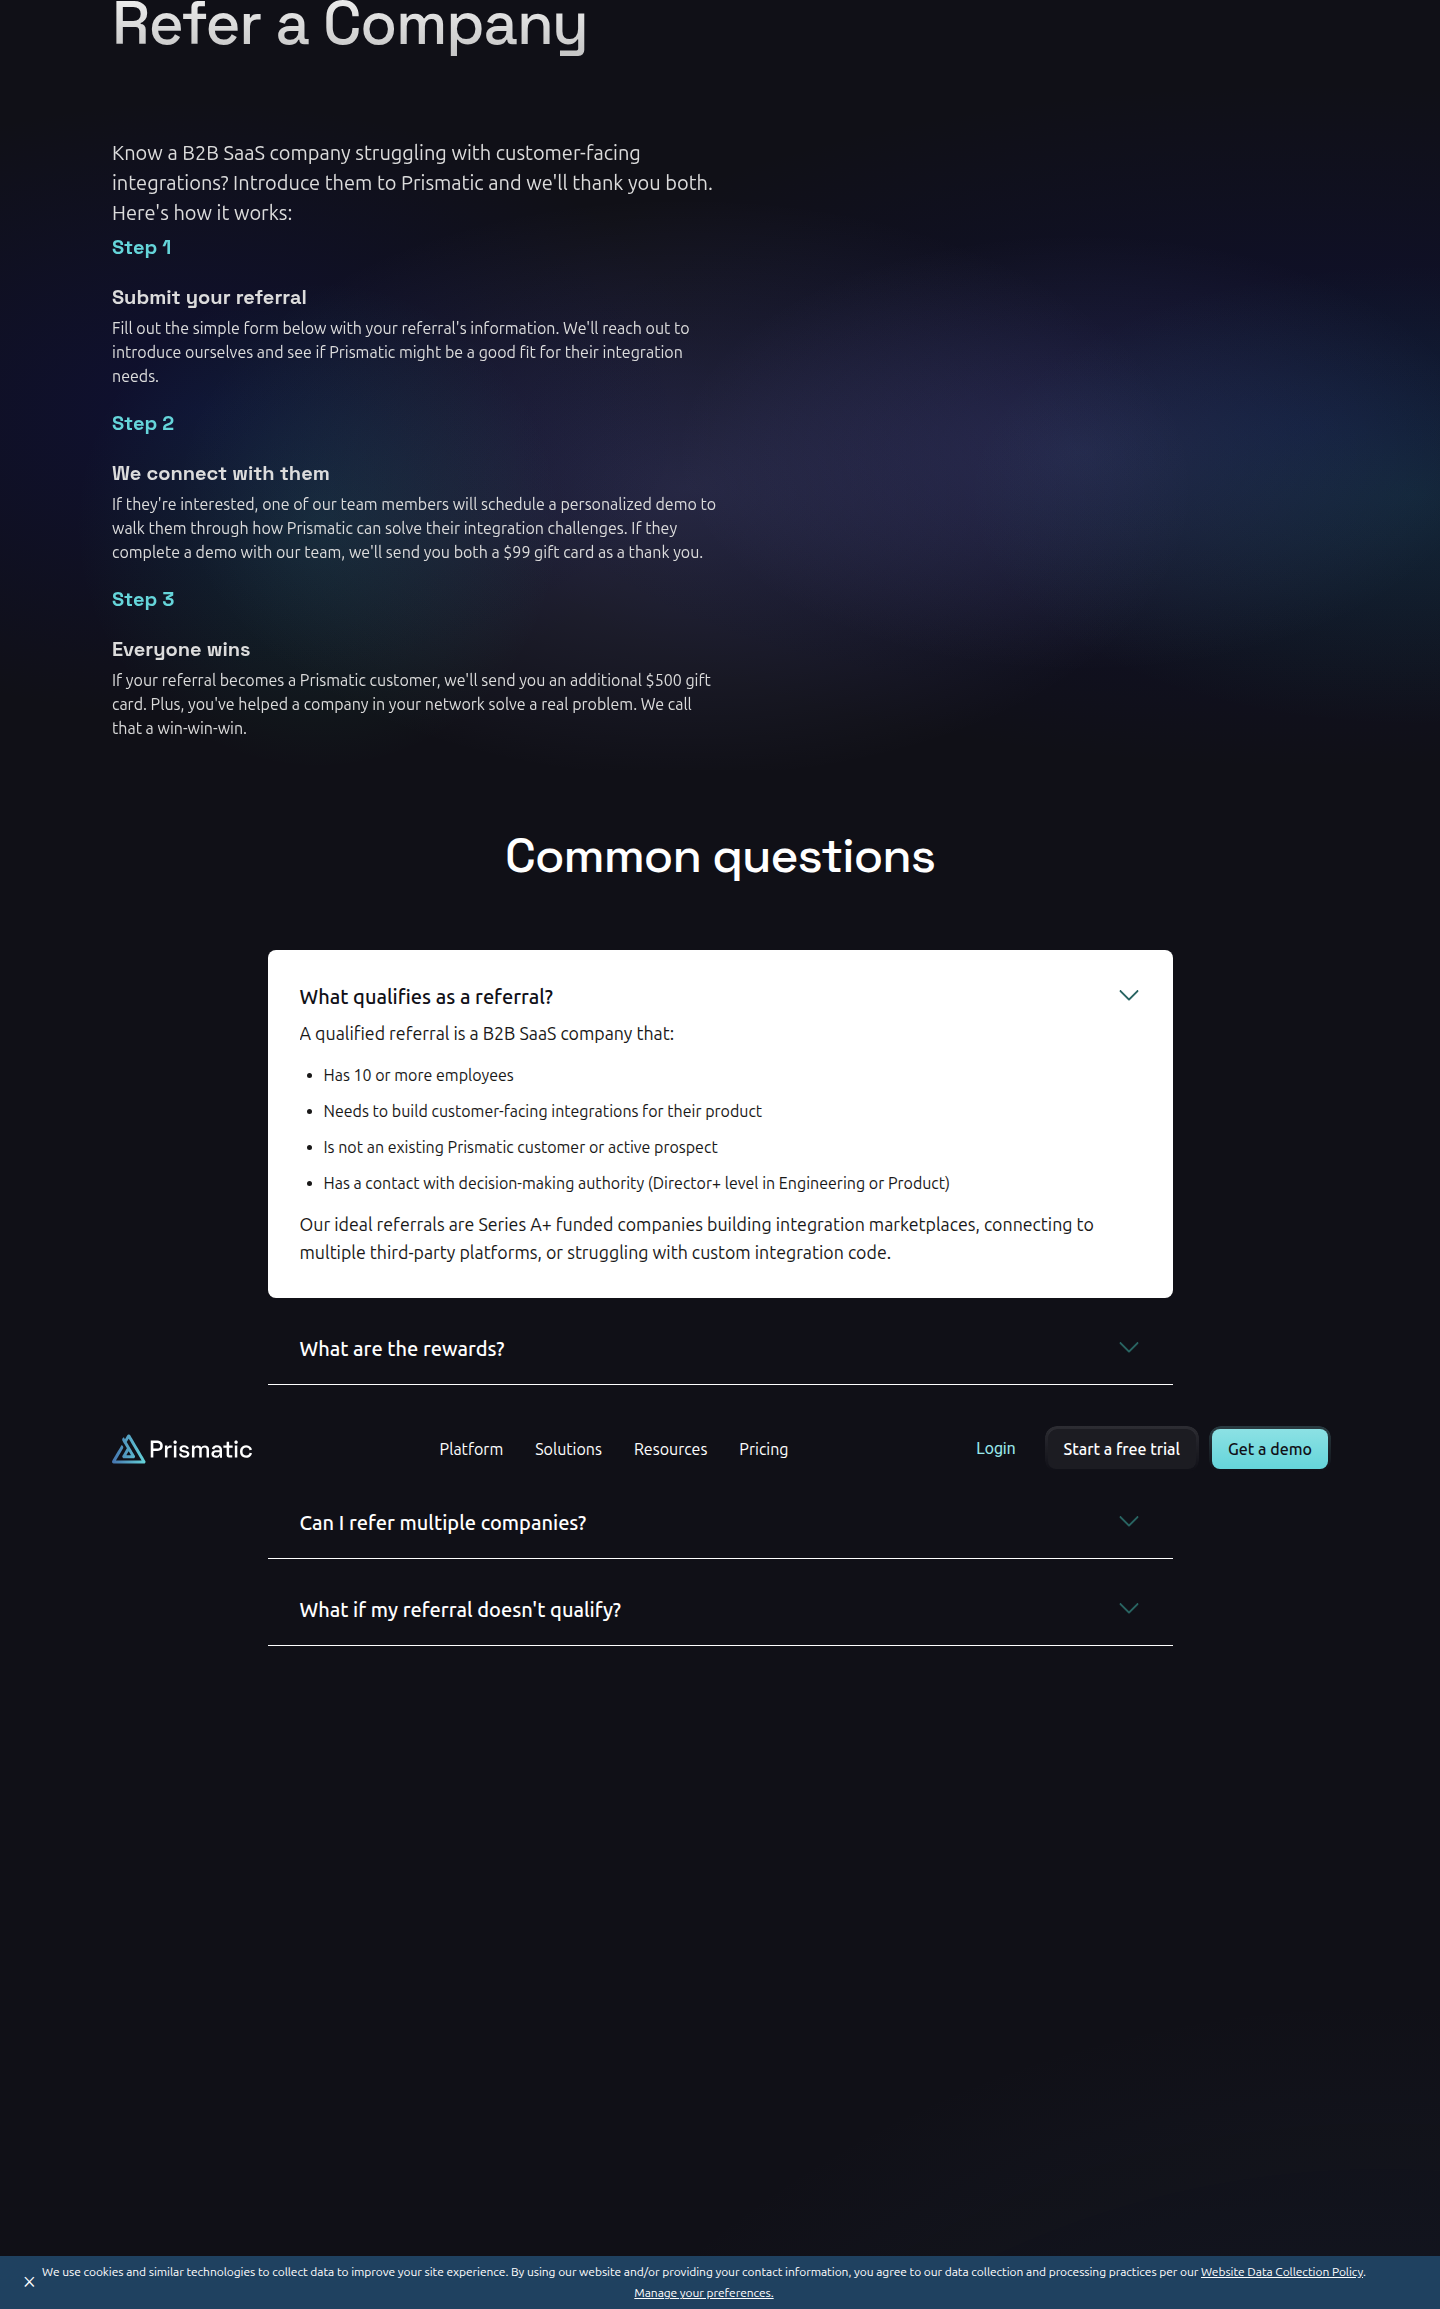
Prismatic's Referral Page Publishes an Actual ICP Checklist
Prismatic's referral landing page replaces vague "know someone who'd like us" copy with explicit ICP qualification criteria. We break down why this pre-qualification pattern is rare and worth testing.
Sam Lee
Data Analyst · · Updated
TL;DR
- Detected on prismatic.io's referral landing page, logged in our CRO scan with a rarity score of 65/100.
- The page lists four explicit ICP criteria instead of generic referral language: 10+ employees, needs customer-facing integrations, not an existing customer/prospect, Director+ contact in Engineering or Product.
- Importance scored 45/100 — a copy-level change, not a structural redesign, but one that touches lead quality directly.
- Category tagged: copy. Surface: other (referral/advocacy page, not pricing or signup).
- Zero A/B test variants observed — this reads as a shipped, permanent pattern, not an active experiment.
- Pattern rarity (65%) suggests fewer than 1 in 3 comparable B2B SaaS referral pages we track use this level of specificity.
What exactly did Prismatic change?
Prismatic's referral page swaps "know someone who might like us" for a four-line qualification checklist, quoted verbatim from the live page. The evidence text reads: "Has 10 or more employees / Needs to build customer-facing integrations / Is not an existing Prismatic customer or active prospect / Has a contact with decision-making authority (Director+ level in Engineering or Product)." That's firmographic (employee count), need-based (integration use case), status-based (not already in-pipeline), and authority-based (title/seniority) filtering — four distinct qualification dimensions stacked in one short block.
Most referral programs we scan across the 1,000+ sites in our index ask for a name and email with a single sentence of framing. Prismatic is asking referrers to self-select against a spec sheet before they even submit a name. That's a meaningfully higher bar, and it's unusual enough that we rated it 65% on rarity — most peer SaaS companies don't publish ICP logic publicly at all, let alone on a conversion surface.
Why would explicit disqualification criteria increase conversion quality?
Coun터-intuitively, narrowing the funnel on a referral page can raise the value of the leads that do convert, even if raw submission volume drops. The mechanism is pre-qualification: every referrer self-selects against four criteria before filling out the form, so sales doesn't waste a qualification call on a 5-person company with no integration need.
This lines up with a well-worn CRO principle — Optimizely's landing page guidance stresses that copy has to match the actual value proposition and traffic intent, because mismatched expectations "tank your conversion rate" downstream, even if the top-of-funnel number looks fine. Prismatic is applying that logic to lead quality rather than headline copy: it's trading top-of-funnel volume for bottom-of-funnel fit.
There's also a trust signal buried in the specificity. "Director+ level in Engineering or Product" and "10+ employees" read as a company that knows its win rate by segment — it's not guessing at ICP, it's publishing it. That kind of specificity functions similarly to the social-proof numbers FullStory recommends for urgency and credibility: precise numbers signal sophistication even when they're not strictly a conversion lever.
How should you read the rarity and importance scores?
At 65% rarity and 45% importance, this is a notable pattern worth testing, not a proven lift — treat it as a hypothesis, not a benchmark. Importance in our scoring reflects estimated impact on the primary conversion metric for the page type; 45% puts this solidly mid-tier, consistent with a copy change on a secondary surface (referral, not pricing or checkout) rather than a high-traffic revenue page.
Here's the thing an analyst has to flag: we have no variant data here. No control group, no reported conversion lift, no sample size. This is a detected pattern, not a reported A/B test result. Any claim that this "improves conversion" is a plausible mechanism, not a measured effect. If Prismatic is running this without a holdout, we can't rule out that referral submission volume simply dropped and nobody's measured whether the quality gain offset it.
| Dimension | Generic referral copy | Prismatic's checklist |
|---|---|---|
| Qualification criteria shown | 0 | 4 (size, need, status, seniority) |
| Self-selection before form fill | No | Yes |
| Estimated effect on raw volume | Baseline | Likely lower (unmeasured) |
| Estimated effect on lead quality | Baseline | Likely higher (unmeasured) |
| Rarity across tracked SaaS referral pages | — | 65% (uncommon) |
What would a real test of this look like?
A defensible test needs a volume baseline, a quality metric downstream of the form, and enough sample to detect a lift in qualified-lead rate, not just submissions. If Prismatic's referral page gets, say, 200 submissions a month, you'd need roughly 385 submissions per arm to detect a 10-percentage-point shift in "meets ICP" rate at 80% power and p<0.05 — call it eight months per variant at that volume. That's a long runway for a secondary page, which is probably why we're seeing this shipped as a permanent change rather than a live experiment: the sample math for a referral page rarely supports a clean A/B run, so teams often ship the directionally-sound version and monitor SQL rate over quarters instead.
Watch for novelty effects too. Early referrers who are already warm, high-fit customers may self-select into the checklist regardless of copy — the first 60 days of data will overstate the effect of the copy itself versus the baseline quality of your referral base.
Common questions
Is this an A/B test or a permanent change?
Based on our detection, this reads as a shipped, permanent page — we found no competing variant in our scans. Prismatic may have tested it previously and rolled out the winner, or shipped directly based on sales team feedback about lead quality, which is common for low-traffic referral pages where statistical testing isn't practical.
Does adding qualification criteria always reduce conversion volume?
Not necessarily measured here, but the mechanism suggests fewer, better-fit submissions rather than more low-fit ones. Whether total qualified-lead count rises or falls depends on how many borderline referrers self-disqualify versus how many submit anyway — that requires funnel data this detection doesn't include.
What's a reasonable benchmark for referral-program conversion rates?
B2B referral landing pages typically convert in the 10-25% range for form completion, per common CRO benchmarks, but "completion" and "qualified completion" are different metrics. A 20% completion rate with 90% ICP-fit beats a 35% completion rate with 40% fit on pipeline value, even though the first number looks worse in a dashboard.
Should SaaS teams copy this pattern directly?
Only if you have sales or CS data showing a specific, recurring disqualification reason — size, title, or use-case mismatch — worth filtering at the point of submission. Otherwise you're adding friction without a documented problem, which is the classic failure mode of copying a competitor's surface-level copy change.
How would you validate this on your own referral page?
Run a pre/post comparison on SQL rate (not just submission count) for at least one full sales cycle, ideally 90+ days, and track self-reported disqualification in form abandonment if your analytics can capture partial fills. That gives you a quality signal even without a clean split-test.
Takeaway for your roadmap this sprint
If your referral or partner page still says "know someone who'd be a good fit," pull your last 20 closed-lost referral leads and see if there's a shared disqualifying trait — company size, missing budget authority, wrong use case. If three or more share the same gap, write it into the page as an explicit criterion, the way Prismatic did, and track SQL rate (not submission volume) for one full sales cycle before calling it a win.
Read next
More from the ABWatcher blog
Nov 22, 2026
Snake River Farms Tests a $25-Off Popup on Its Ad Landing Page
We caught Snake River Farms split-testing an email-capture form and $25-off modal on its landing page. Here's the math on what it would take to call a winner.
Nov 21, 2026
Snake River Farms Tests Mid-Page Email Capture on Its Ad Landing Page
SRF is A/B testing a mid-page lead-capture block and a $25-off popup against a simpler hero-only promo banner on its paid landing page, detected 2024 week-over-week.
Nov 20, 2026
Attio Is Testing a New Tier, Higher Prices, and a New Pitch
Attio is running a live pricing page test with a new $1,000 "Ultra" tier, higher Plus/Pro prices, and a new headline — here's what we caught and what it means.
Nov 19, 2026
Found Quietly Tested a 25% Price Cut on Its Pricing Page
We caught Found running a live pricing A/B test with an annual billing toggle that drops Found Plus from $35 to $26.25/mo. Here's what changed and why it matters.
Nov 8, 2026
Astro Proves "Zero Lock-In" With a Live Code Demo, Not a Claim
Astro's homepage replaces a trust badge row with a working, clickable framework demo — here's the hierarchy and interaction design behind it, detected 60% rare on astro.build.
Nov 7, 2026
Basecamp's Big Numbers: Why Hyper-Precise Stats Beat Vague Social Proof
Basecamp's homepage swaps "trusted by thousands" for 1.7 billion to-dos and 5 petabytes of data. We break down why precision beats vagueness as social proof — and how to test it.
From the glossary
Vocabulary the article uses. See all terms →
- Shrinkage Estimator— A statistical adjustment that pulls noisy per-variant or per-segment estimates toward an overall average to reduce overfitting to randomness.
- Flicker Test— A diagnostic check to confirm whether users briefly see the original page before a variant renders in client-side experiments.
- Pre-Experiment Bucketing Audit— A review process confirming users are being randomly and evenly assigned to experiment variants before launch.
- Above-Fold Exclusion Rule— A test-design rule that deliberately prevents changes to above-the-fold elements so an experiment isolates below-the-fold effects.
- Flicker-Free Testing— A technical setup that prevents users from briefly seeing the original page before a test variant loads.
- Orthogonal Test Design— A test structure where multiple variables are changed independently so their individual effects can be measured without interference.
See more like this
ABWatcher catches A/B tests like this across 1,000+ brands.
Watch live experiments at 1,000+ high-converting brands, complete with hypothesis and takeaway. 7 days of Pro, free, no card, then Free forever for ten watched companies.